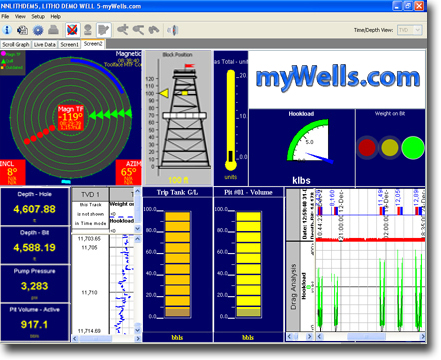
Add a Screen Overview
It is possible to see dials, gauges, thermometers, and
even the local weather patterns of any particular well by adding a screen.
These screens are fully customizable and any well configuration can have multiple screens.
Note: Maintaining components and graphs uses system resources. Multiple pages and numerous unnecessary components can cause a computer to work slowly. A slowly functioning display may indicate that too many components has been added to RTSG and that the number of components should be limited, or the computer should be upgraded.

|
|
|
Description |

|
A scroll graph widget used to graph variables set for 1-second data capture. |
|
|
|
A representation of live data using text as depicted
above with Bit RPM and Pit |
|
|
|
A graphic representation of the location of the travelling block relative to the rig floor and crown. |
|
|
|
A graphic representation of data as depicted above with Hookload. Dial gauges may be circular, half-circle (as depicted), or quarter-circle gauges. |
|
|
|
|
A horizontal scroll graph with Hookload and Bit Depth data over time. See Adding a Drag Analysis for more information. |
|
|
A fully-featured scroll graph for inclusion on the custom screens. |
|
|
|
Any image on your local computer, network, or the Internet for which you know the path. |
|
|
|
The Level Gauge Component is a rectangular graphic component using a color to indicate the current level, much like a fluid level gauge. As the data increases or decreases, the fill color increases. The "fluid" level can be set to be transparent, which assists in viewing level gauge color indicators, or it can be set to a specific color. |
|
|
|
A graphic representation of live data with green light, yellow light, and red light levels, typically used to help with drilling efficiency. |
|
|
|
A graphic representation of live data as depicted above with the Gas Total % ME. See Adding Dials and Gauges to RTSG for more information about the topics above. |
|
|
|
A
graphical representation of the location of the |


